Generating a water effect, part 1. SVG and Canvas
This is a 3 part breakdown of how this water effect works, you can view the finished demo here: https://a-toon-ocean.adarose.dev/
Source code for this first part is at the bottom of the article.
It was partly inspired by the water effects in Zelda Wind Waker.
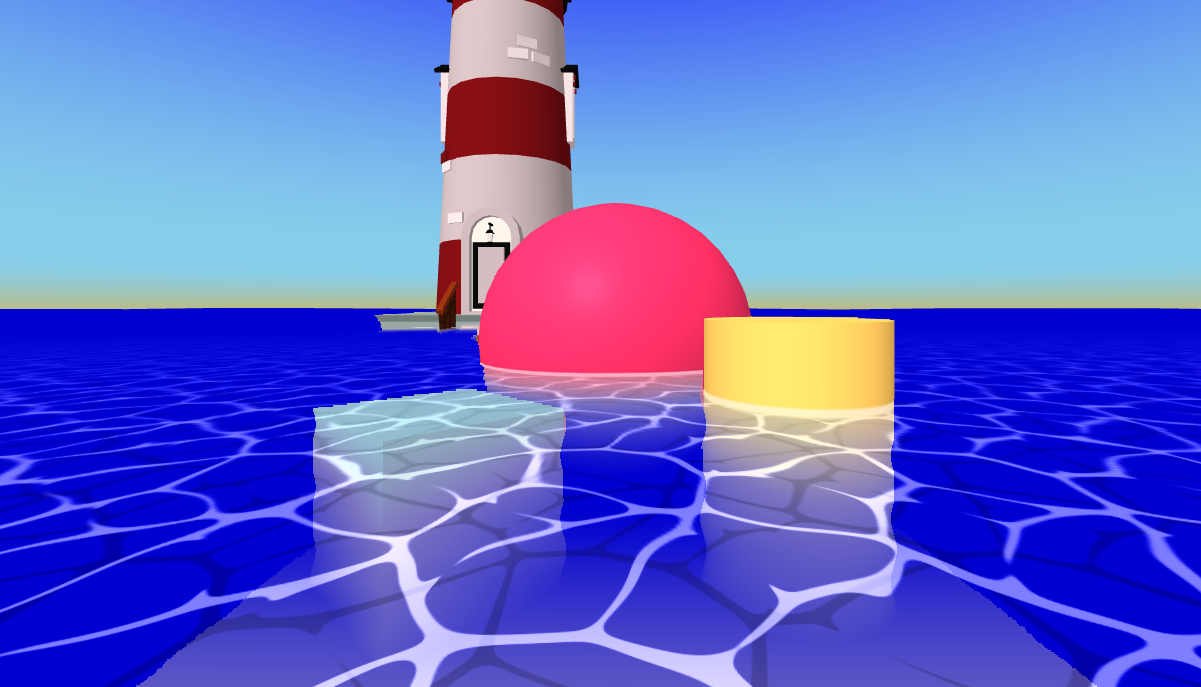 Screenshot of the finished demo.
The first thing we need to do is make a good texture for the water. This is a picture to make these lines on the surface of the water. If you look carefully you’ll see it is a repeating pattern, but the picture is carefully designed to hide that fact and there are tricks we can use later on to hide it further.
When I began making this effect I used a dummy image for the water, but making our own is probably the best place to start since we will need to use it in later steps.
The finished texture should
-
Tile seamlessly
-
appear pretty random and organic
-
not obviously tesselate
Step 1. Generate Shapes
There is a type of diagram known as a Voronoi Diagram it describes areas which are closest to a particular point.
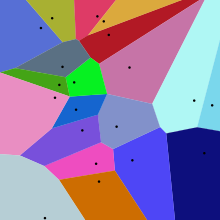 Voronoi diagram from Wikipedia
This is often used for working out catchment areas for public utilities like schools and doctors by finding the area closest to that point.
It generates nice looking cells which seemed like they could be a good starting point.
I used this library to do the calculations. For this project I combined it with some helper functions from some of the demos in the source code and put them into an ES6 module.
I tested it out by running it on 15 random points.
import { Voronoi } from './voronoi.js';

const nPoints = 15;
const voronoi = new Voronoi();
const sites = [];
const width = 512;
const height = 512;

// xl is x-left, xr is x-right, yt is y-top, and yb is y-bottom
const bbox = {xl: -width, xr: width*2, yt: -height, yb: height*2};

for (let i=0;i<nPoints;i++) sites.push({
  x: Math.random() * width,
  y: Math.random() * height,
});

const shapes = voronoi.compute(sites, bbox);
Doing this returned a set of cells and described their edges. Which is hard to examine without some kind of visual output.
There are a few ways I could render this output. My initial instinct was to draw it to a HTML Canvas but I knew that later I would want to run some fancy SVG filters on it, so I decided to turn these points into SVG polygons to view them.
First step is to generate the SVG and give it a white background and add a group element
const svg = document.createElementNS(
  "[http://www.w3.org/2000/svg](http://www.w3.org/2000/svg)", 'svg'
);

svg.setAttribute('xmlns', "[http://www.w3.org/2000/svg](http://www.w3.org/2000/svg)");
svg.setAttribute('viewBox', `0 0 ${width} ${height}`);
svg.setAttribute('style', `width:${width}px; height:${height}px;`);
svg.setAttribute('width', width);
svg.setAttribute('height', height);
document.body.append(svg);

svg.innerHTML = `
<rect x="0" y="0" width="100%" height="100%" fill="white" />
<g></g>
`;
This just makes a white SVG rectangle we now want to draw our cells, each cell will be a new
const g = svg.querySelector('g');

for (const cell of shapes.cells) {
  if (!cell.halfedges[0]) continue;
  const p = document.createElementNS(
    "[http://www.w3.org/2000/svg](http://www.w3.org/2000/svg)", 'polygon'
  );
  const vertices = [];
  vertices.push(cell.halfedges[0].getStartpoint());
  for (const halfEdge of cell.halfedges) {
    vertices.push(halfEdge.getEndpoint());
  }
  p.setAttribute('points',
    vertices.map(vertex => `${vertex.x},${vertex.y}`).join(' ')
  );
  p.setAttribute('style',
    "fill:green;stroke-width:1;stroke:white;"
  );
  g.appendChild(p);
}
The end result shows it is working as expected:
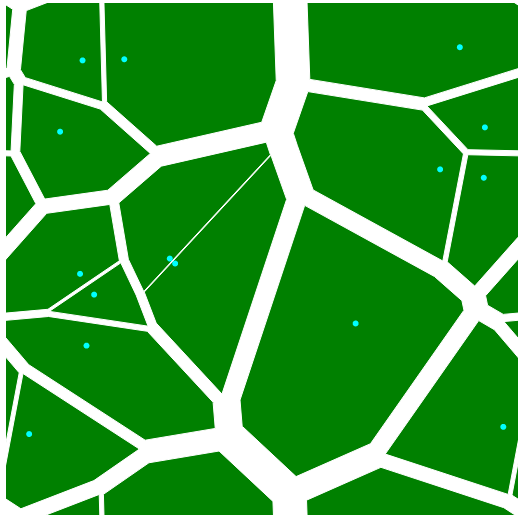
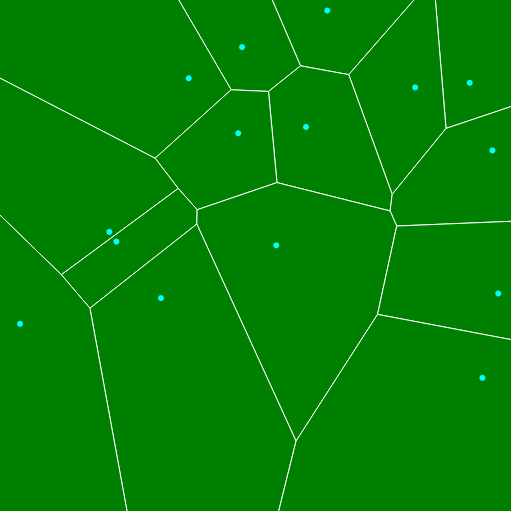 Our rendered SVG, I have added circles at each site location.
Unfortunately this does not tile. To make it tile we can duplicate all the points on the 8 adjacent squares. That’s 8 times above, below, left, right and the diagonals, before we compute the cells.
Most of the polygons will be rendered off the edges of the SVGs viewBox but they will be cut off by the boundaries of the viewBox.
const originalSites = sites.splice(0);
for (let i=-1;i<=1;i++) {
  for (let j=-1;j<=1;j++) {
    for (const site of originalSites) {
      sites.push({
        x: site.x + width*i,
        y: site.y + height*j,
      });
    }
  }
}
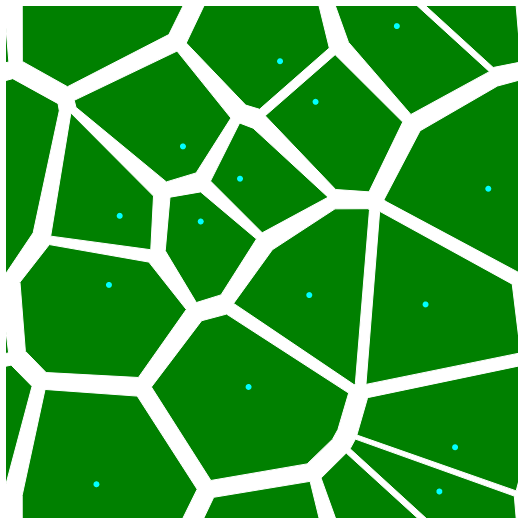
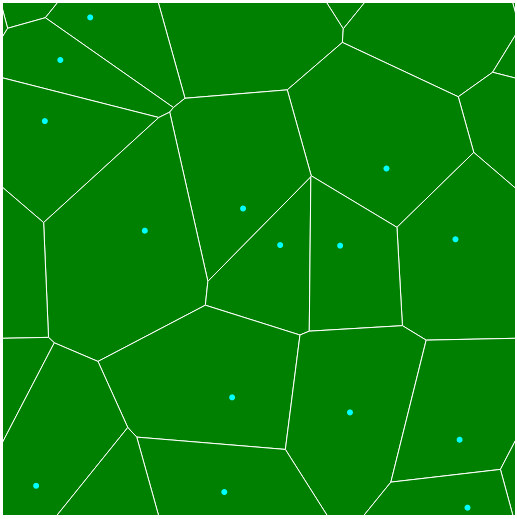 Now it tiles.
Next we will increase the spacing between each polygon by moving the vertices of each polygon a certain amount towards the center. First we will write a linear interpolation (lerp) function which returns a point that lies on a line between two other points.
function lerp(p1,p2,t=0.5) {
  return {
    x: p1.x + (p2.x - p1.x) * t,
    y: p1.y + (p2.y - p1.y) * t,
  }
}
Then we will apply this to move each vertex a little bit between it’s current location and the cell site (marked as a cyan circle).
p.setAttribute('points', vertices
  .map(vertex => lerp(cell.site, vertex, 0.9)) // this line is new
  .map(vertex => `${vertex.x},${vertex.y}`).join(' '));
This looks okay, but some lines are too thick and some are too thin. So instead of doing a constant lerp we will make it try to be a consistent distance.
p.setAttribute('points',
vertices
.map(vertex => {
  const targetGap = 10;
  const d = distance(cell.site, vertex);
  const t = 1 - targetGap/Math.max(d, targetGap);
  return lerp(cell.site, vertex, t)
})
.map(vertex => `${vertex.x},${vertex.y}`).join(' '));
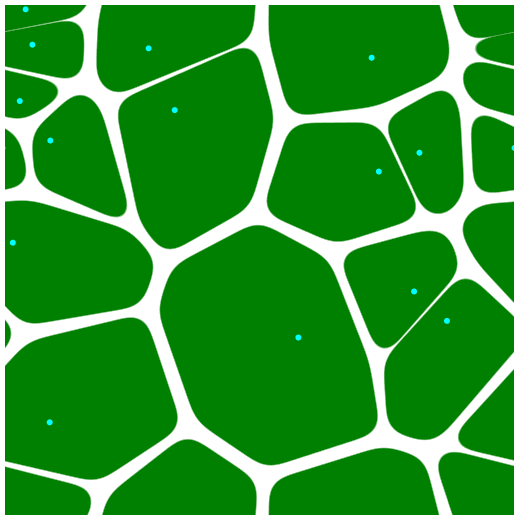
This new interpolation looks a little more even and aesthetically pleasing.
 Lerp applied
This is looking better but still too angular. To fix this we are going to use a trick I found on CSS Tricks for Gooey Effects. I love this effect.
If we apply it as a filter to each polygon we get nice rounded corners.
svg.innerHTML = `

<defs>
<filter id="goo">
<feGaussianBlur in="SourceGraphic" result="blur" stdDeviation="10"></feGaussianBlur>
<feColorMatrix in="blur" mode="matrix" values="1 0 0 0 0  0 1 0 0 0  0 0 1 0 0  0 0 0 18 -7" result="goo"></feColorMatrix>
<feComposite in="SourceGraphic" in2="goo" operator="atop"></feComposite>
</filter>
</defs>
<rect x="0" y="0" width="100%" height="100%" fill="white" />
<g></g>`;

...

p.setAttribute('style', "fill:green;filter: url(#goo);");
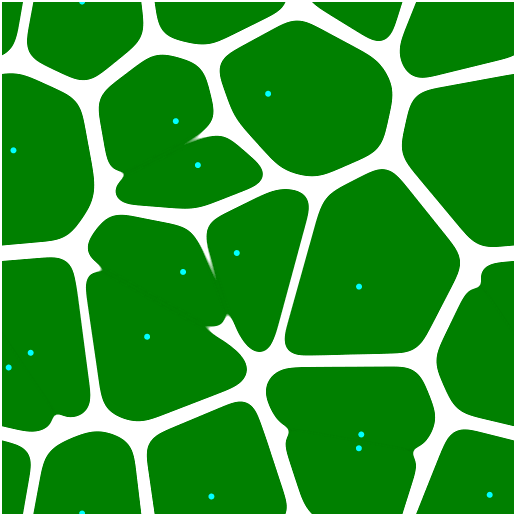
 Getting closer.
This is looking even better, but some of the fine lines look a little too fine so we can then apply a slightly modified goo effect to the group as well.
svg.innerHTML = `
<defs>
<filter id="goo">
    <feGaussianBlur in="SourceGraphic" result="blur" stdDeviation="10"></feGaussianBlur>
    <feColorMatrix in="blur" mode="matrix" values="1 0 0 0 0  0 1 0 0 0  0 0 1 0 0  0 0 0 18 -7" result="goo"></feColorMatrix>
    <feComposite in="SourceGraphic" in2="goo" operator="atop"></feComposite>
</filter>
<filter id="goo2">
    <feGaussianBlur in="SourceGraphic" result="blur" stdDeviation="4"></feGaussianBlur>
    <feColorMatrix in="blur" mode="matrix" values="1 0 0 0 0  0 1 0 0 0  0 0 1 0 0  0 0 0 14 -8" result="goo"></feColorMatrix>
    <feComposite in="SourceGraphic" in2="goo" operator="atop"></feComposite>
</filter>
</defs>
<rect x="0" y="0" width="100%" height="100%" fill="white" />
<g style="filter: url(#goo2)"></g>`;
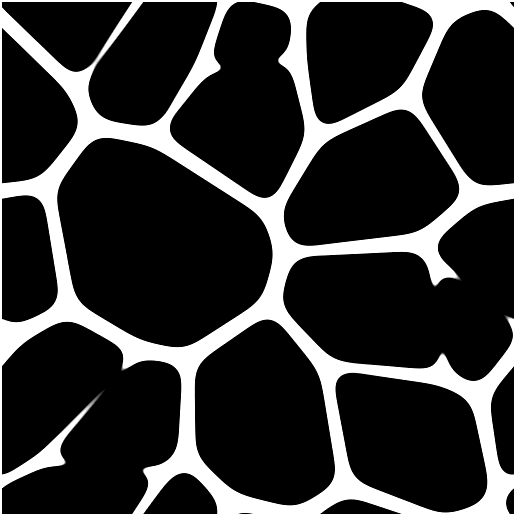
 The final result looks pretty good!
Now we just need to make it black and white to use it as a texture for WebGL.
Unfortunately SVG can’t be used in WebGL directly — it has to be rasterised to a canvas which involves a little trickery:
const canvas = document.createElement('canvas');
canvas.width = width;
canvas.height = height;
const img = document.createElement('img');
const blob = new Blob([svg.outerHTML], {type: 'image/svg+xml'});
const url = URL.createObjectURL(blob);
img.onload = function() {
  canvas.getContext('2d').drawImage(img, 0, 0);
  URL.revokeObjectURL(url);
}
img.src = url;
This will encode the SVG we made to a URL and assign it to the image. Once the image is loaded we can write it to a canvas. We use THREE.CanvasTexture to then load the image back.
const canvasTexture = new CanvasTexture(canvas);
canvasTexture.wrapS = canvasTexture.wrapT = RepeatWrapping;

...

image.onload = function () {
  ...
  canvasTexture.needsUpdate = true;
}
It’s now ready to use in WebGL.
Next we will look at making this as a shader for use with AFrame.
By Ada Rose Cannon on February 11, 2020.